
Returnable Asset Management: You Can't Automate What You Don't Know
You own the assets, but you can’t account for them
Ask a supply chain team how many returnable containers it bought last year, and the answer comes quickly. Ask how many it lost, and the answer is usually an estimate. Losses show up as purchase orders for replacements, obscuring a simple question: why are you buying containers you’ve already paid for?
A container leaves the plant on a 4 a.m. delivery, and SAP records the shipment. For the next few days or weeks, it sits in a store backroom, rides in a distributor’s truck, or ends up behind someone else’s dock, and none of that creates a transaction. The ERP records the purchase, the shipment, and the return. It has no record of the time in between, so no one can answer from the system where a container is, who has it, or how long it has been there. We covered this blind spot from the logistics side in Where’s Your Stuff? Why Your ERP Goes Blind the Moment Product Leaves the Dock.
The cost lands on several desks. Plant managers have no live count of on-site versus in-transit assets. Production planners learn about a shortage when a line is already waiting for containers. QA and fleet managers audit site by site. The VP or Director of Supply Chain carries the capital tied up in lost and idle assets, while replacement orders hide how large the loss has become.
The gap matters more as planning moves to AI. More than a third of the 767 US operations and supply chain leaders in PwC’s 2026 Digital Trends in Operations Survey say they are already comfortable assigning AI agents to run full end-to-end operational processes. A planner who sees a short container count can call the distribution center first. An AI planning tool reads the same count as fact.
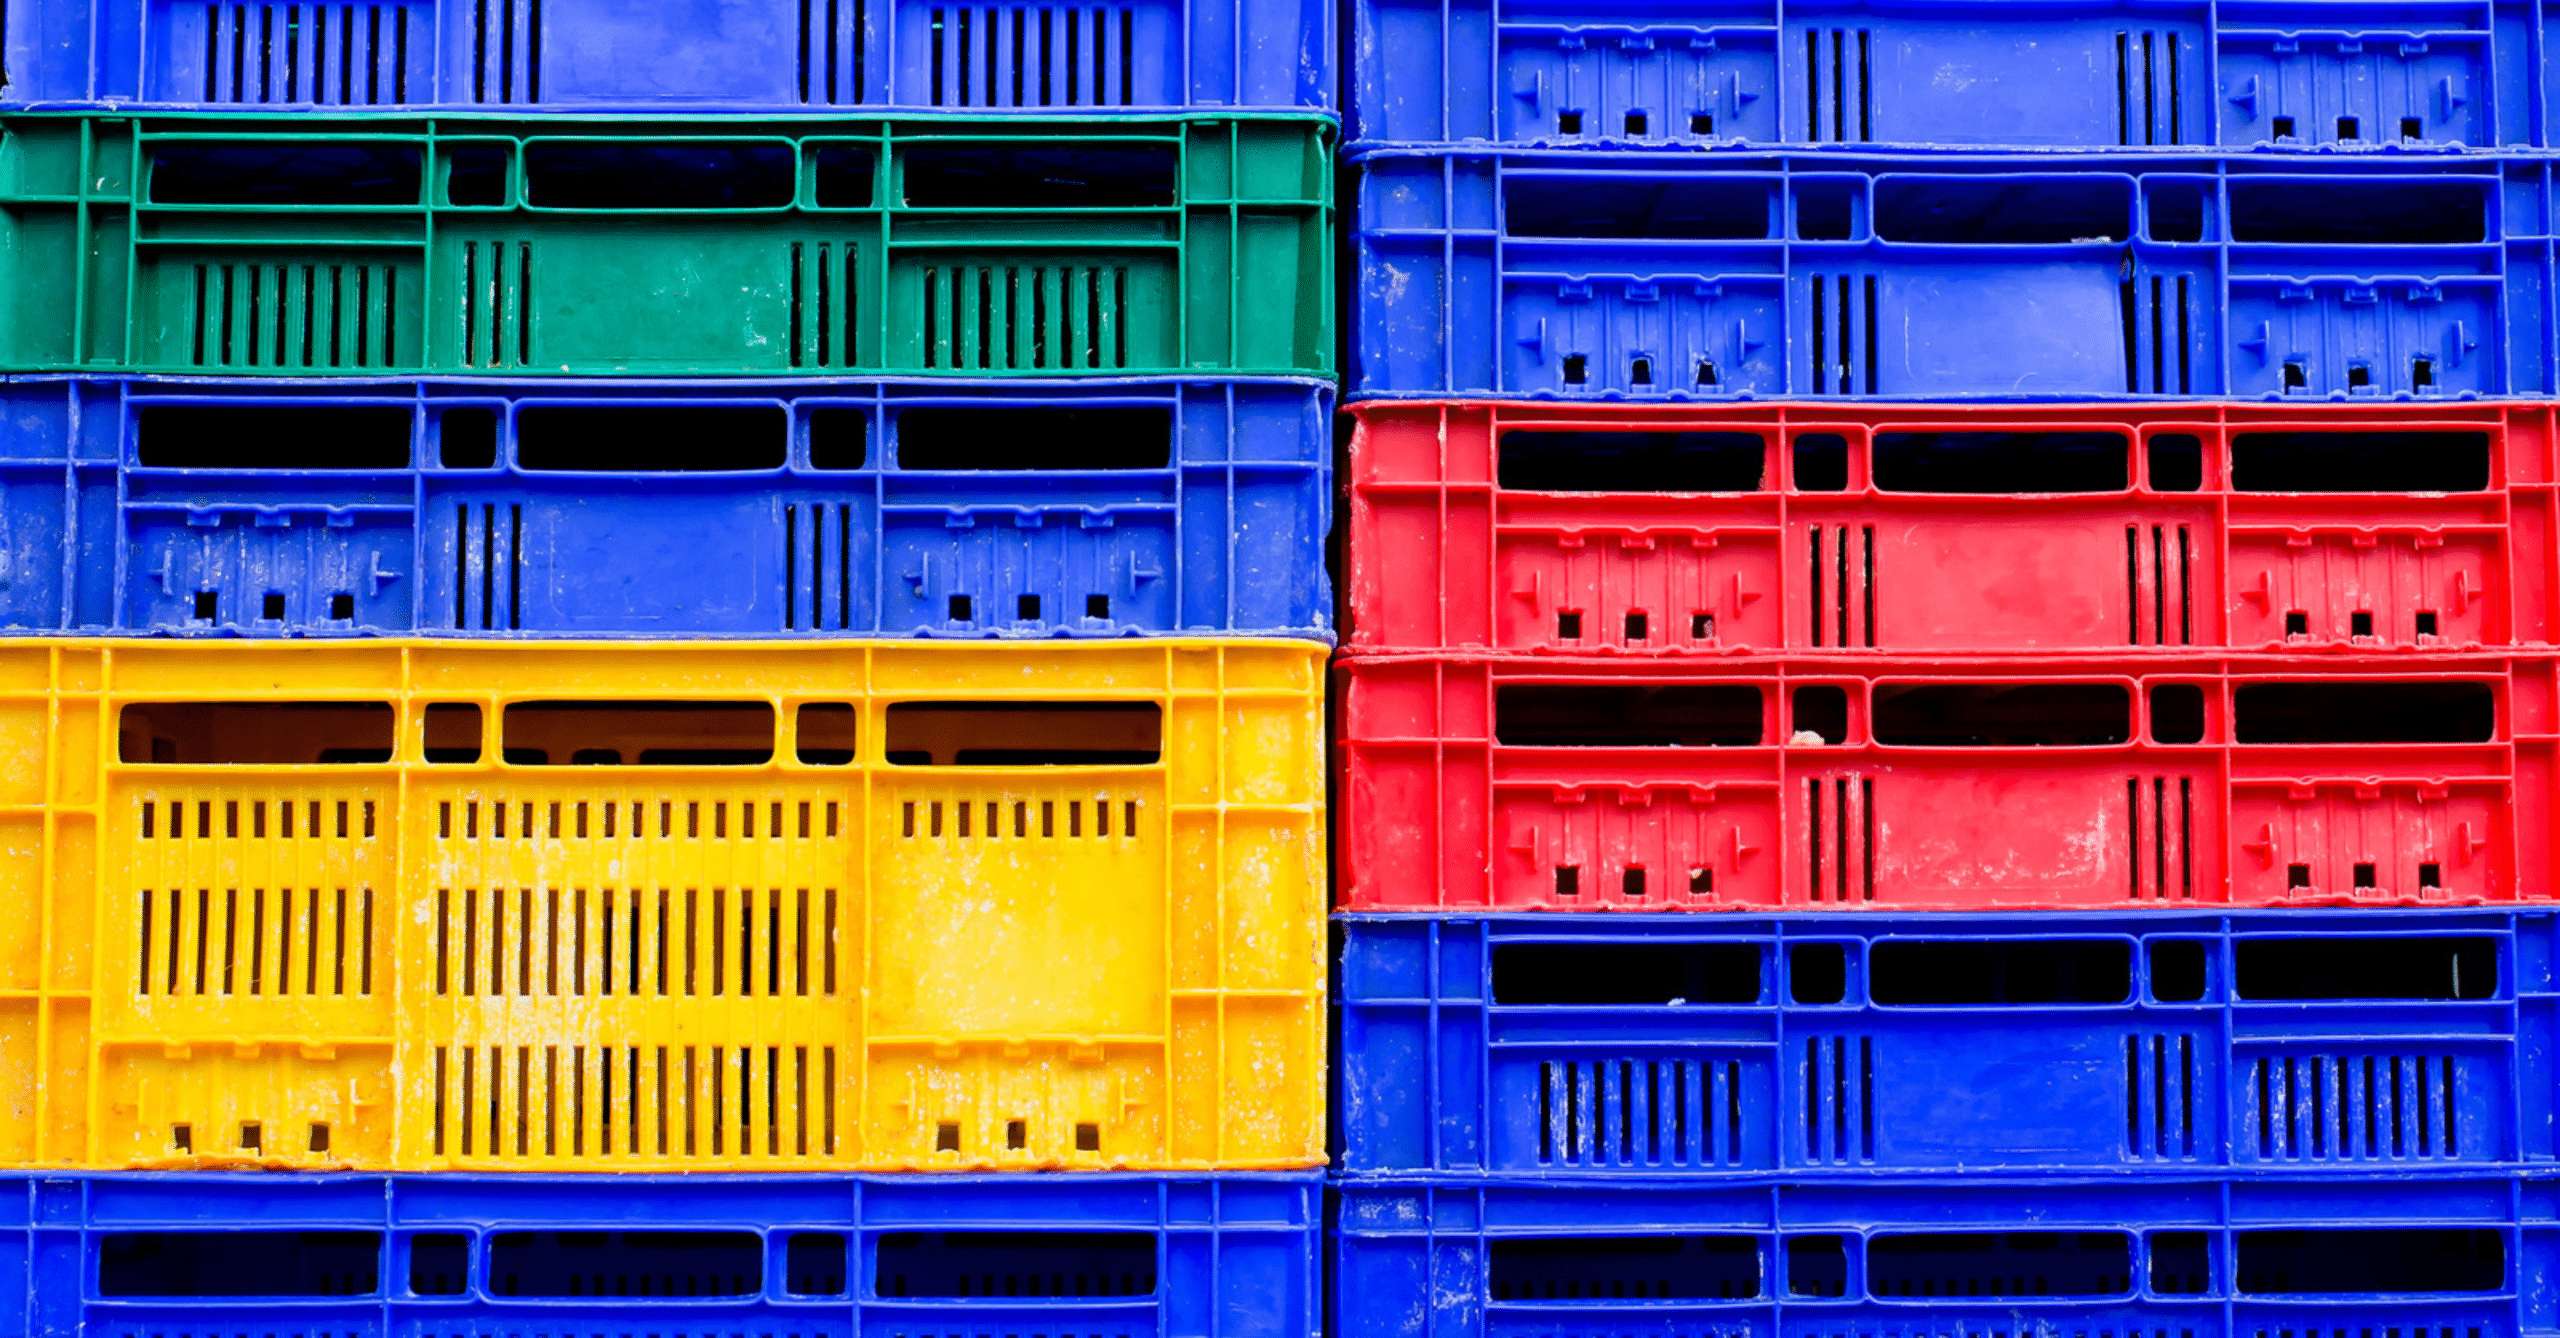
Returnable asset management (RAM) closes that gap by tracking returnable transport items (RTIs) such as trays, totes, containers, IBCs, pallets and racks between shipment and return.
What lost containers really cost
The business case starts with three numbers: RTIs in circulation, replacement cost per RTI, and the share that never comes back.
ACSIS estimates that 15% to 30% of returnable assets are lost, stolen, damaged, or misplaced each year (ACSIS).
One global bakery customer had about 8 million trays moving across 11,000 distribution routes, each tray costing around $7, and losses of more than $5 million a year (case study). At $7 per tray, $5 million would be roughly 714,000 trays, or 9% of the fleet. This is an illustrative calculation, not a loss rate the customer reported.
Replacement is only part of the cost. When containers run out, the line waits. Manual counts and searches take labor, and chargeback disputes with retailers and partners are hard to settle without scan records.
Companies shipping in the EU also face reuse requirements under the Packaging and Packaging Waste Regulation (Regulation (EU) 2025/40). From 2030, Article 29 sets a 40% reusable-packaging target for specified transport packaging, including pallets, trays, plastic crates and intermediate bulk containers. Separate provisions apply to certain movements between company sites and business-to-business deliveries within a member state, while cardboard boxes are exempt from these transport-packaging obligations. Asset-level records are one input to that reporting, helping companies monitor reusable packaging flows.
The need usually turns urgent when a new distribution center or plant opens, when the replacement budget keeps growing, or when a merger forces a reconciliation of assets across sites.
How returnable asset management restores visibility
ACSIS Returnable Asset Management works in four steps:
- Capture. The technology depends on the asset and the workflow. Barcodes are read at scan points, RFID tags at fixed readers such as dock doors, and GPS and IoT trackers report location between sites. At the bakery, each tray and dolly carries an RFID tag and a barcode.
- Connect. Each read updates location and status in the ACSIS Cloud Platform and in SAP through native integration, without manual entry. (How SAP Systems Integrate with Supply Chain Visibility)
- Analyze. Utilization, cycle-time, and loss-pattern analytics show where assets sit idle or go missing, and partner-level scorecards show which partners hold them longest. (Why RFID Reads Need Business Context)
- Act. Alerts and replenishment triggers flag a shortage before a line stops, and lifecycle records track maintenance, washing, and inspection.
ACSIS reports typical results of 20% to 30% lower annual replacement costs and 15% to 30% fewer RTIs required (ACSIS).
A global bakery customer cut costs by a third
Challenge. About 8 million trays moved across 11,000 distribution routes with no live count. Inventory was reconciled by hand, and reorders hid how large the losses had become: more than $5 million a year.
Solution. ACSIS tagged each tray and dolly with RFID and a barcode, then tracked movements across the network through the ACSIS Cloud Platform, with configurable KPIs and automatic alerts. This visibility helped the bakery identify where trays accumulated or went missing, instead of relying on replacement orders to reveal the problem.
Result. A 33% reduction in costs and projected savings of more than $10 million over five years (read the case study).
Find your leakage
- Size the loss. Use the ACSIS ROI calculator to estimate your monthly container losses and the cost of idle containers, cycle counts, and search time.
- Start where the leakage is. Pick the routes, customers, or partners where containers disappear most or sit longest. Those are usually where disputes already happen.
- Decide who is accountable at partner sites. Reads at your own docks are the easy part. Loss happens at customer and distributor sites, so decide early who records assets there and with what device. For a US food distributor managing reusable totes across more than 50,000 convenience store locations, ACSIS enabled real-time asset tracking and verifiable accountability for drivers and customers (case study).
- Track four numbers. Loss rate, cycle time, dwell time by partner, and fleet utilization.
Every replacement container is an asset the company already paid for once. Knowing where assets are, who has them, and how long they have been there helps supply chain teams cut avoidable replacement costs and make better replenishment decisions. That same operational data is what planners need today and what AI planning tools will need before they act. AI needs ground truth. ACSIS captures it.
Run the numbers
Use the ACSIS ROI calculator to estimate your exposure to replacement costs, idle assets and manual counting.
Ready to explore the solution?
Explore ACSIS Returnable Asset Management or request a demo.